Redefining Aerosol Measurement at the Source
Introduced in 1990, the In-Stack Low-Pressure Impactor (LPI) enabled direct measurement of airborne particles in industrial stacks. Unlike traditional samplers, the LPI does not wait for emissions to reach the scientist, it goes straight to the source.

What Makes the LPI Stand Out?
- Direct In-Stack Sampling
No more dilution or transport systems. The LPI captures particles inside the stack, preserving their true size and shape. - Measurement of a Wide Range of Particle Sizes
Traditional in-stack impactors at the time were unable to capture and preserve the true morphology and size distributions of aerosols smaller than 0.3 micrometers (see below for more information). The last six impactor stages operate at low pressure, reducing aerodynamic drag and enabling collection of ultrafine particles. - Unique Insight into Industrial Emissions
Direct measurement of aerosols over wide size range provides key insight into the nature of emissions from industrial stacks, potentially helping frame new science-based air quality standards.
Operating Principle
The LPI operates with the same idea as traditional impactors except half of its stages operate at a lower pressure (Figure 2). The first stages of the LPI provides stages with a traditional range particle size measurement (identified as "normal stages"). This part of the impactor is optimized for larger particles (>0.5 µm) with large inertia. It features relatively wide, round nozzles that separate and collect coarse aerosols.
The lower section is where the LPI truly shines. Upon exiting the normal stages, the air passes through several critical orifices that substantially lower the pressure of the subsequent stages. Operating under reduced pressure, it uses finely tuned nozzles and low-velocity flow paths to isolate ultrafine particles, including those smaller than 0.1 µm. These particles typically evade capture in standard impactors due to their low inertia, but the LPI’s design ensures they are measured without distortion.
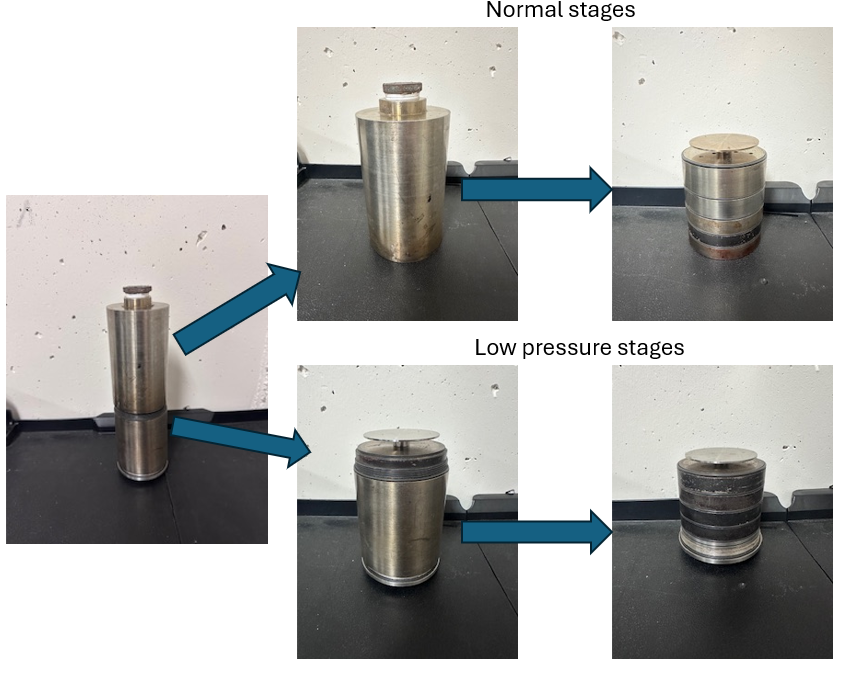
Figure 2: Flow chart showing different sections of the Low-Pressure Impactor. Photos taken in the laboratory
Closer look at the stages
Figure 3 gives us a closer look at the stages. Notice the acceleration nozzles (right) and the toad-stool impaction plate at left.
Application of the LPI
- The LPI has been used extensively in stack emission monitoring, it was even used to sample and size-classify particulate exhaust from jet engine test cells, specifically the J79 engine. Lundgren, D. A., & Vanderpool, R. W. (1989). Design and calibration of an in-stack, low-pressure impactor (Report No. ADA213531). U.S. Air Force Engineering & Services Center. Retrieved from https://apps.dtic.mil/sti/tr/pdf/ADA213531.pdf
The LPI was used in developing a sub micrometer aerosol generator for use in EPA's Human Exposure Laboratory. Peters, T. M., Chein, H., Lundgren, D. A., & Berntsen, J. (1994). Submicrometer Aerosol Generator Development for the U.S. Environmental Protection Agency’s Human Exposure Laboratory. Aerosol Science and Technology, 20(1), 51–61. https://doi.org/10.1080/02786829408959663